
In today’s competitive business landscape, customer satisfaction is crucial to maintaining a thriving enterprise. Companies strive to meet and exceed customer expectations by understanding their needs and preferences.
Customer satisfaction surveys have long been the standard approach for gathering feedback. Typically administered after a customer interaction or transaction, these surveys aim to collect insights into customers’ perceptions, experiences, and overall satisfaction. Organizations have relied on these surveys to identify areas for improvement and gauge customer loyalty. However, they suffer from a few limitations:
First, these surveys often have a significant time gap between customer interactions and survey responses. This delay hampers the immediacy of feedback, hindering timely action on any issues raised. These surveys can also be influenced by response bias, where customers may provide inaccurate or incomplete responses due to memory recall or social desirability bias. This can lead to skewed data and an incomplete understanding of customer sentiment.
Finally, many customers choose not to participate in surveys, resulting in low response rates. This can limit the representativeness of the data collected, potentially leading to biased conclusions.
Advancements in technology, specifically sentiment analysis, have opened up new avenues for monitoring customer satisfaction in near real-time. This article explores the benefits of sentiment analysis in replacing customer satisfaction surveys, enabling companies to gain timely insights and enhance customer experiences. For this, I’ve joined the high velocity of Redis and the advanced capabilities of Google Cloud to implement a real-time customer satisfaction monitoring system.
What is Sentiment Analysis?
Sentiment analysis is a subset of natural language processing (NLP) that comes under the text classification category. Using machine learning algorithms, sentiment analysis automatically categorizes text data into positive, negative, or neutral sentiments. The ultimate goal of sentiment analysis is to decipher interactions’ underlying moods (emotions and sentiments). This is also known as Opinion Mining.
Sentiment and Emotion Analyses enable companies to analyze and understand the overall mood behind customer feedback. This powerful tool empowers businesses to extract valuable insights from various customer touchpoints, such as social media posts, online reviews, customer support interactions, call centers, and more.
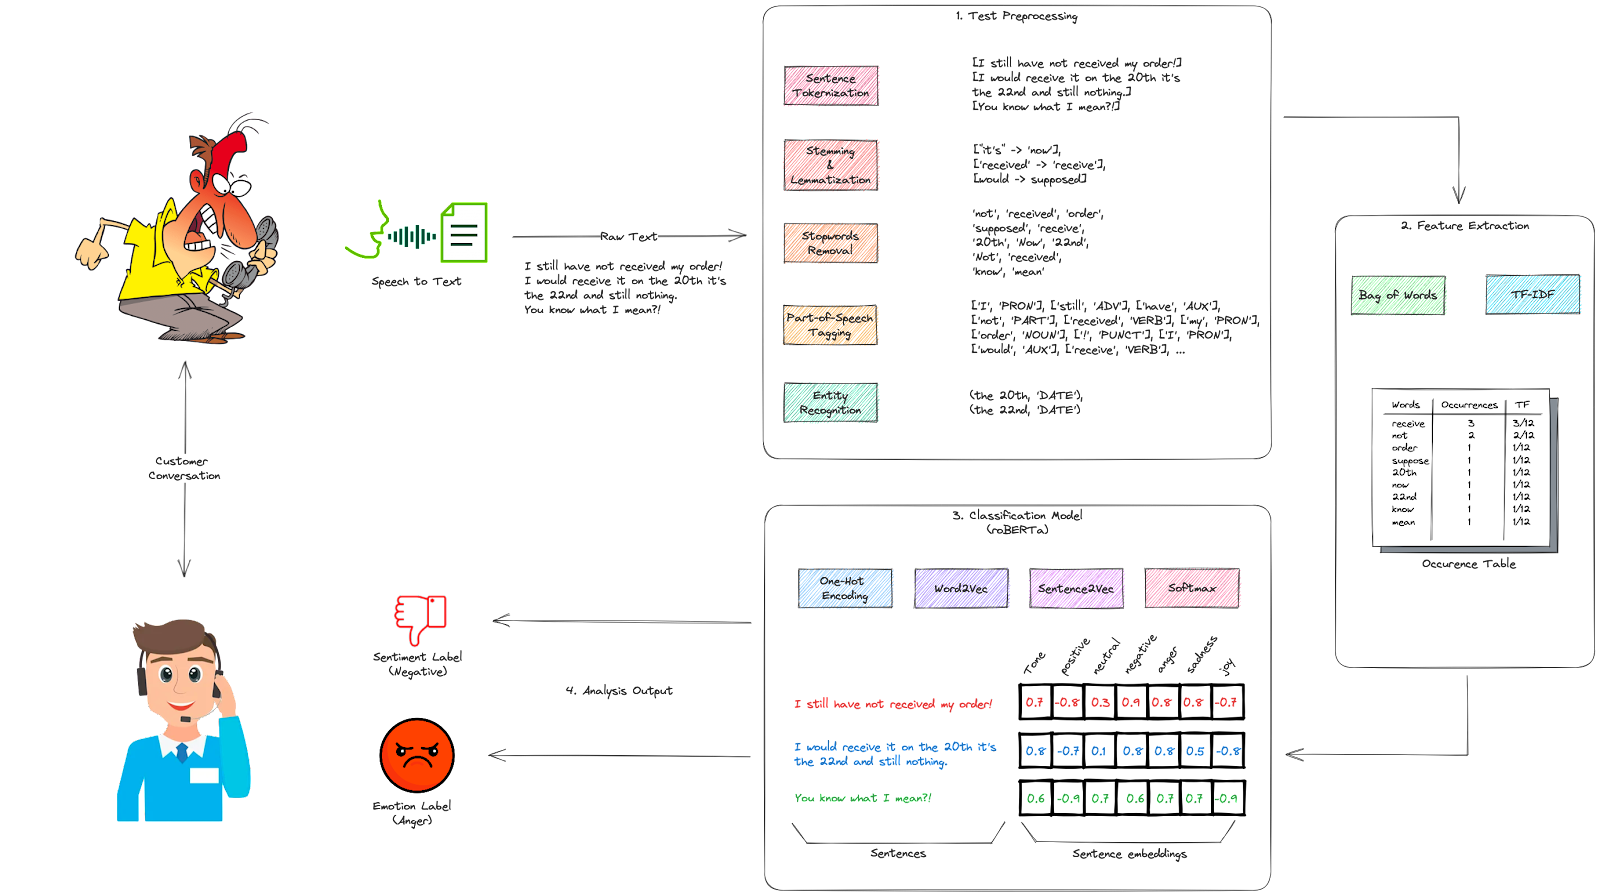
The process of sentiment analysis involves several steps:
1. Text Preprocessing: The first step is cleaning and preprocessing text data. This step consists of:
- Tokenization: the text is divided into individual units called tokens. These tokens can be words, phrases, or even individual characters, depending on the level of analysis desired.
- Stemming: reducing words to their root or base form, known as the stem. The stem may not always be a valid word, but it represents the word’s core meaning without considering grammatical variations or affixes. Stemming algorithms apply various heuristic rules to remove suffixes or prefixes from words, aiming to derive the common root form. Stemming aims to normalize words so that related words with similar meanings are treated as the same word. This helps in reducing vocabulary size and improving computational efficiency in text processing. For instance, stemming the word ‘Caring‘ would return the word ‘Car‘.
- Lemmatization: reducing words to their base or canonical form, known as the lemma. The lemma represents the dictionary form or the root form of a word. The purpose of lemmatization is to group together different inflected forms of a word so that they can be analyzed as a single unit. Lemmatization takes into account the morphological variations of words and applies linguistic rules to transform them into their base form. This involves considering factors such as the word’s part of speech (e.g., noun, verb, adjective) and the context in which it appears. Lemmatizing the previous example word ‘Caring‘ would return the word ‘Care‘ instead of ‘Car’ when you use stemming.
- Stopword removal: the process of removing unnecessary elements such as punctuation, stop words (common words like “and,” “the,” etc.), and special characters. Additionally, the text may be converted to lowercase for consistency.
- Part-of-Speech (POS) tagging: the process that assigns grammatical tags to words in a given text, indicating their respective parts of speech. The parts of speech include nouns, verbs, adjectives, adverbs, pronouns, prepositions, conjunctions, and more. POS tagging is important in language understanding because it helps to determine the syntactic structure and grammatical relationships between words in a sentence.
- Entity Recognition: also known as Named Entity Recognition (NER), is a crucial task that involves identifying and classifying named entities within a text. Named entities are specific pieces of information that can be categorized into predefined classes such as person names, locations, organizations, dates, and more. The goal of entity recognition is to extract and label these named entities from unstructured text data, enabling the identification of important information and relationships within a text.
2. Feature Extraction: In order to analyze sentiment, relevant features need to be extracted from the text. This can include identifying important words or phrases, part-of-speech tagging, calculating the word occurrences (bags of words) and frequency (TF-IDF), and extracting n-grams (continuous sequences of words) that provide additional context.
3. Sentiment Classification: The extracted features are then used to classify the sentiment of the text. Machine learning algorithms are trained on labeled datasets where human annotators assign sentiment labels (positive, negative, or neutral) to the text. In addition, some other algorithms might assign emotion labels (happy, sad, angry…) to this text. These algorithms learn patterns and relationships between the features and labels, enabling them to classify new, unseen text based on the known patterns. Various machine learning techniques such as Naïve Bayes, Support Vector Machines (SVM), or deep learning models like Recurrent Neural Networks (RNN) or Transformers are commonly employed.
4. Analysis Output: Once the model is trained, it can be used to analyze new, unseen text data. The output is typically a sentiment/emotion label (positive, negative, neutral, joy, sadness, anger…) and a score associated with the analyzed text. The score indicates confidence in the label. So the highest scores are always associated with the prevalent sentiments/emotions of the text…
Benefits of Real-Time Sentiment & Emotion Analyses
Let’s delve into the significance of sentiment and emotion analyses and how organizations can benefit from them.
Imagine you have launched an e-commerce platform selling a wide range of items. You have partnered with parcel transportation companies such as DHL and UPS to deliver your products. And, of course, because customers continue to appreciate the “human touch”, especially when they seek assistance, you have a small call center that receives hundreds/thousands of calls daily from your customers.
As customers flock to your website, you realize the need to ensure that every parcel is delivered on time as expected. This is a critical differentiator you have compared to your competitors. The idea is to keep customer satisfaction high and act quickly when an issue occurs. You can’t afford to wait several days to get the customer’s feedback from post-order surveys. When a problem occurs (e.g., parcel loss), you need to capture the customer’s feedback while he is calling your call center. This allows your company to react fast, escalate to your partners and find an acceptable solution for your customers. This is where sentiment analysis comes to the rescue.

To simplify the process, when your call center receives a customer’s calls, the conversation is transcribed, and sentiment and emotion analyses are applied to it. A few Monitoring dashboards allow the call center operators to gauge and assess the customer’s satisfaction. Thus, they can adapt their answers and try their best to find an acceptable solution.
This also allows gathering some statistics in real-time such as overall satisfaction of all inbound calls, percentiles of negative/positive sentiments, and the average satisfaction scores between low fractions and high fractions of feedback.
Satisfaction Monitoring System using Redis & GCP
Redis Enterprise has three functions in a satisfaction monitoring solution. First, it’s used as a multi-model primary database that stores and indexes the JSON documents (call transcript), uses the t-digest and Top-k data structures to make statistical calculations such as samples distribution, percentiles, and satisfaction scoring, and finally, as an online feature store operated by machine learning algorithms on Google Cloud. A single Redis cluster can serve all of these functions. It doesn’t have to be separate clusters.
A Cloud function consumes the call transcript received by PubSub, infers the satisfaction scores, makes statistical calculations, and sinks all the outcomes into Redis databases.
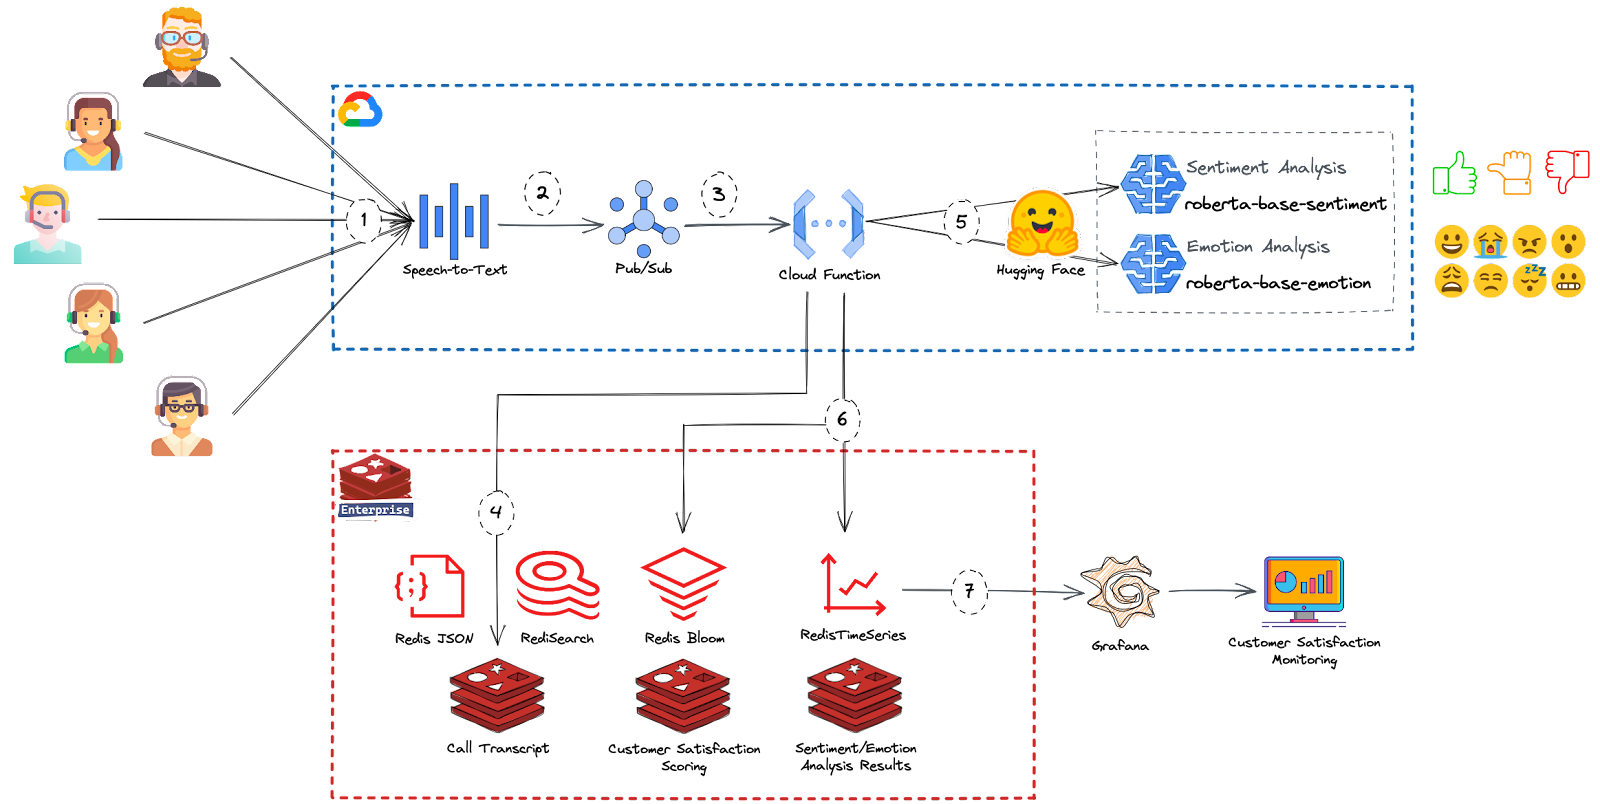
The following diagram depicts the solution architecture implemented with Redis Enterprise and GCP.
As a pre-requisite, you must choose how you perform satisfaction rate analysis. You can use a rule-based analyzer like VADER (Valence Aware Dictionary and sEntiment Reasoner). This approach consists of creating a set of predefined rules or patterns that determine the sentiment of a text. These rules can be based on keywords, linguistic patterns, or sentiment lexicons (dictionaries of words and their associated sentiments). The sentiment of the text is determined by matching the words or patterns in the text against the predefined rules. However, this approach requires regular updates and human validation for the rules to provide accurate results.
When it comes to performing machine learning algorithms, there are several approaches and techniques to perform sentiment analysis. Machine learning algorithms can be trained to classify the sentiment of text data based on labeled examples. The process involves extracting relevant features from the text, such as word frequencies, n-grams, or syntactic structures, and using them as inputs to train a classification model. Common machine learning algorithms used for sentiment analysis include Naïve Bayes, Support Vector Machines (SVM), Random Forests, Recurrent Neural Networks (RNN), Convolutional Neural Networks (CNN), and Transformers.
Transformer-based models represent a cutting-edge advancement in Natural Language Processing (NLP) techniques. These models utilize an Encoder-Decoder architecture and incorporate self-attention mechanisms to deliver remarkable outcomes. While it is possible to build a transformer model from the ground up, it can be a laborious process. Thankfully, Hugging Face provides a solution by offering pre-trained transformer models. Hugging Face is an open-source AI community that provides a diverse range of pre-trained models tailored for NLP applications. These models can be readily employed as-is or fine-tuned to cater to specific tasks, saving time and effort in the development process. In this article, we used two transformer models from Hugging Face, both based on the roBERTa-base model, trained on ~58M tweets, and fine-tuned for sentiment and emotion recognition.
1. The data flow starts with the call center operators invoking Google Cloud Speech-To-Text API for conversation transcription.
2. Google Cloud PubSub is used to capture conversation transcriptions in real-time. Cloud PubSub is a fully managed service for event data processing at any scale.
3. Cloud Functions is a serverless compute solution for developers to create stand-alone functions that respond to Cloud events without the need to manage a server or runtime environment. In our solution, the Cloud function is triggered by PubSub to read the incoming data and perform the following actions:
4. Persist conversation content in RedisJSON to enable low-latency indexing and querying of the transcript.
5. To calculate customer satisfaction, the cloud function calls the transformer models endpoints from Hugging Face to assign sentiment and emotion scores to incoming sentences.
def perform_inference(data_payload):
    print("** perform_inference - START")
    output = {}
    sentiment_labels=["negative","neutral","positive"]
    emotion_labels=["anger","joy","optimism","sadness"]

    output["sentiment_analysis"] = get_analysis(data_payload, "sentiment", sentiment_labels)
    output["emotion_analysis"] = get_analysis(data_payload, "emotion", emotion_labels)

    print("** perform_inference - END")
    return output
- Sentiment / Emotion Analyses:
def get_analysis(data, task, labels):
    MODEL = f"cardiffnlp/twitter-roberta-base-{task}"

    tokenizer = AutoTokenizer.from_pretrained(MODEL)
    tokenizer.save_pretrained("/tmp")

    model = AutoModelForSequenceClassification.from_pretrained(MODEL)
    model.save_pretrained("/tmp")

    encoded_input = tokenizer(data, return_tensors='pt')
    output = model(**encoded_input)
    scores = output[0][0].detach().numpy()
    scores = softmax(scores)

    ranking = np.argsort(scores)
    ranking = ranking[::-1]
    output = []
    for i in range(scores.shape[0]):
        l = labels[ranking[i]]
        s = scores[ranking[i]]
        output.insert(i, {'label_index' : int(ranking[i]),'label' : l, 'score' : np.round(float(s), 4)})

    return output
6. Cloud function further persists the satisfaction analysis results to Redis Enterprise. The function uses RedisBloom to calculate sentiments and emotions statistically and stores the results in a time-series database for further data visualizations using Grafana.
def persist_conversation_score(customer_id,satisfaction_score):
    print("** persist_conversation_score - START")
    now = datetime.datetime.now() # current date and time
    trans_date_trans_time = now.strftime("%Y/%m/%d-%H:%M:%S")
    key = "customer-satisfaction:" + customer_id

    data = {}
    data['end_time'] = trans_date_trans_time
    data['score'] = satisfaction_score

    # Merging the conversation end time and overall score
    redis_client.json().merge(key, Path.root_path(), data)

    # Adding the satisfaction Score to the t-digest structure
    redis_client.tdigest().add("satisfaction-tdigest", [float(satisfaction_score)])

    print("** persist_conversation_score - END")
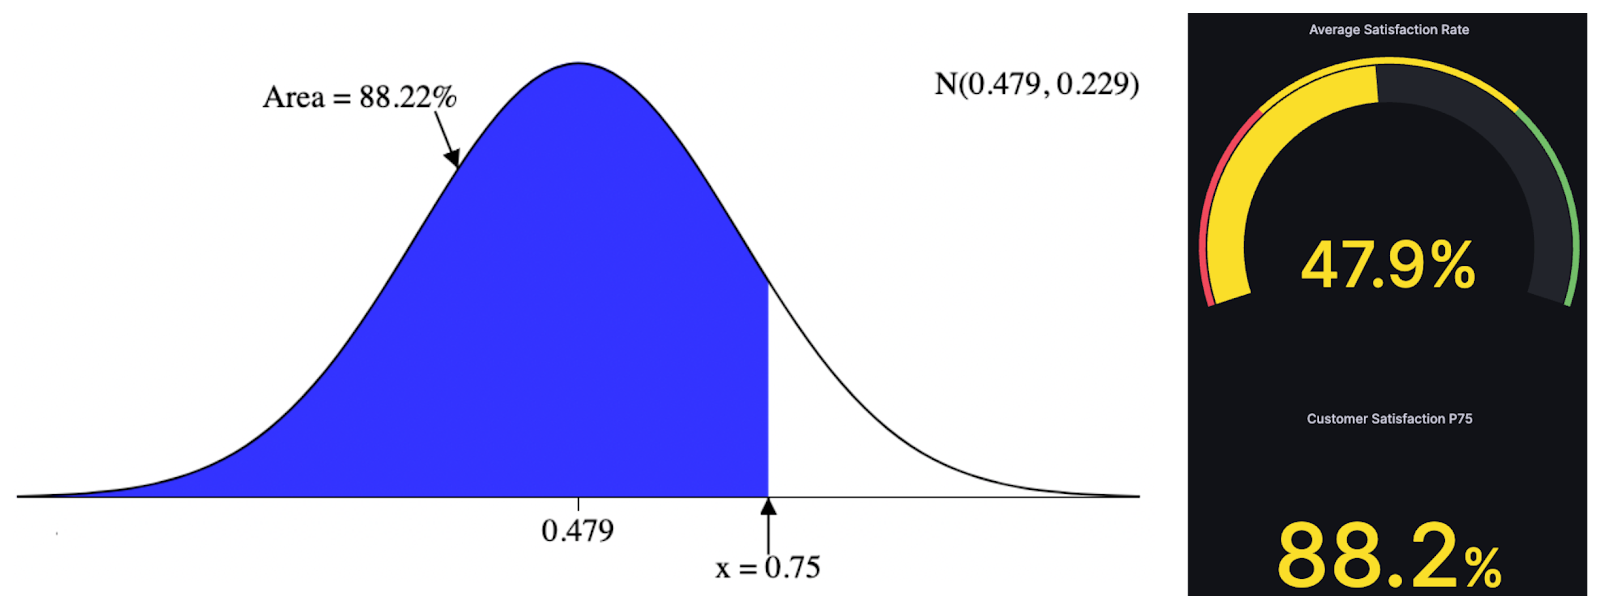
Below is the Grafana dashboard that shows real-time customer satisfaction scores for incoming calls. The dashboard displays the overall satisfaction score and current sentiments/emotions of any inbound conversation. In addition, other charts are used to visualize changes in satisfaction scores over time and to compare different sentiments and emotions (bottom side). The source code of this solution is available in the following Github Repository.

In addition, you can measure central tendency using Redis Bloom. Sometimes you may want to know the value beneath which a certain percentage of customer satisfaction lies. For example, you may want to find the 75th percentile (third quartile), which represents the lowest satisfaction rate that is smaller than or equal to 75%, and the fraction of this percentile regarding the overall scores.
According to this article, “The t-digest is an online algorithm for building small sketches of data that can be used to approximate rank-based statistics with high accuracy, particularly near the tails. This new kind of sketch is robust with respect to skewed distributions, repeated samples, and ordered datasets. Separately computed sketches can be combined with little or no loss in accuracy”.
In the example below, the t-digest contains the following 17 observations representing the satisfaction rates collected from 17 customers’ calls: 32%, 64.5%, 98%, 82%, 33%, 18.5%, 32%, 19%, 21%, 56%, 61.3%, 61%, 61%, 60%, 53%, 32%, 45%, and 46%. As you can see, this distribution is skewed to the left. For this reason, we can use the t-digest data structure of Redis Bloom that returns, for each input value, an estimation of the fraction of observations smaller than a given satisfaction rate.
$ TDIGEST.CDF satisfaction-tdigest 0.75
1) "0.88235294117647056"
Thus, calculating the quantile fractions using a t-digest indicates that 88.2% of customers have a lower satisfaction rate than 75%. In other terms, only 11.8% of customers exceed a satisfaction rate of 75%, which represents a low satisfaction level.
Summary
Customer satisfaction surveys have long been the backbone of gauging customer sentiment, but their limitations have become apparent in today’s fast-paced business environment. Sentiment and emotion analyses emerge as powerful tools that allow companies to monitor customer satisfaction in real-time, replacing post-sales surveys. By harnessing the benefits of sentiment analysis, organizations can gain immediate insights, proactively address issues, personalize experiences, and optimize resource allocation. As businesses continue to prioritize customer satisfaction, real-time sentiment analysis proves to be an invaluable asset in staying ahead of the competition and meeting evolving customer expectations.
In this article, we explored how Redis Enterprise and Google Cloud services helped implement a real-time customer satisfaction monitoring platform. The high velocity of Redis, in addition to the Bloom probabilistic data structures, provides companies with instant access to customer feedback. By monitoring customer sentiments in real time, businesses can quickly identify both positive and negative experiences. This enables them to respond promptly, address concerns, and capitalize on positive feedback to amplify customer satisfaction.
References
- t-digest: a new probabilistic data structure in Redis Stack, Redis Blog
- The t-digest: Efficient estimates of distributions, Ted Dunning, Software Impacts (Elsevier), Volume 7, 2021
- How to perform sentiment analysis on earnings call of companies, Towards Data Science
- Sentiment Analysis in Python, Hugging Face