
You’ve reached the last stage of the data journey - serving data for downstream use cases. Now that the data has been ingested, stored, and processed into coherent and valuable structures, it’s time to get value from your data.
Data serving is the most exciting part of the data lifecycle. This is where the magic happens: The serving stage is about data in action. But what is a productive use of data? To answer this question, you need to consider two things: what’s the use case, and who’s the user?
In this post, you will see different ways to serve data: You’ll prepare data for statistical analysis and visualization. These are the most traditional data-serving areas - where business stakeholders get visibility and insights from the collected raw data.
Then, you will see how to serve data for machine learning. In fact, to avoid the well-known mantra “Garbage in, Garbage out,” it is impossible to start machine learning without high-quality data appropriately prepared. Through the data journey, data engineers work along with data scientists and ML engineers to acquire, transform, and deliver the data necessary for model training.
Finally, you will see how to serve data through a reverse ETL. Reverse ETL stands for sending the processed data back to data sources. This has become increasingly important as organizations seek to use their data in more meaningful and impactful ways. By moving processed data back to operational systems, organizations can enable data-driven decision-making at the point of action. This allows businesses to respond to changing conditions and make more informed real-time decisions.
Analytics
Analytics is the core of most data endeavors. It consists of interpreting and drawing insights from processed data to make informed decisions or predictions about future trends. But, again, data visualization tools can be used here to help visualize data more meaningfully.
Identifying the end-use case is the first step before serving data for analytics. The end use case determines the type of analytics required, such as historical trends, automatic anomaly detection (e.g., fraud detection), or real-time notifications and reports on a mobile application. These different use cases illustrate the distinctions between business analytics (commonly Business Intelligence or BI), operational analytics, and embedded analytics, each with specific serving requirements and objectives.
1 - Business Analytics
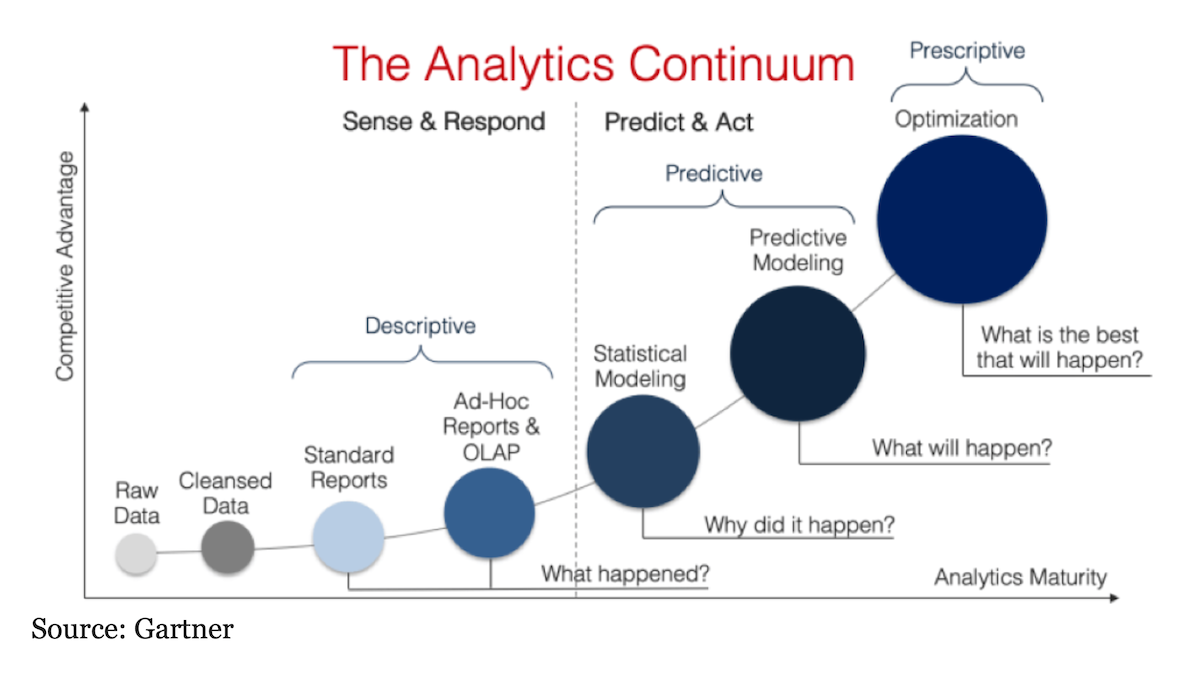
Business analytics leverages both historical and present data to formulate strategic and practical decisions. These decisions often consider longer-term trends and require a combination of statistical analysis, trend analysis, and domain knowledge. In essence, business analysis is a fusion of science and art, where human judgment and expertise play an integral role alongside analytical techniques. Business analytics can be organized into six categories:
- Descriptive Analysis: This analysis answers the “What happened?” question. The descriptive analysis provides an understanding of what has occurred in the past. It consists of summarizing data to describe what is happening in the dataset, using aggregation functions (i.e., counts, averages, frequencies…) It does not attempt to explain why things happened or determine any cause-and-effect relationships; its purpose is simply to give a concise overview.
- Exploratory Data Analysis (EDA): focuses on exploring and understanding a dataset by using visualizations like histograms, box plots, scatterplots, etc., to uncover patterns and relationships between variables that may not be immediately obvious from looking at summary statistics alone.
- Diagnostic Analysis: This analysis answers the “Why did it happen?” question. The diagnostic analysis aims to uncover the root cause behind an observed phenomenon. Through this type of analysis, you can identify and respond to anomalies in your data. When running diagnostic analysis, you might employ several different techniques, such as probability, regression, filtering, and time-series analysis.
- Inferential Analysis: Inferential analysis is a statistical technique that uses data from a small sample to make inferences about the larger population. It relies on the central limit theorem, which states that given enough samples of random variables, their distribution will tend toward normal. It can estimate parameters in the underlying population with an associated uncertainty or standard deviation measure. To ensure accuracy, it is important for your sampling scheme to accurately represent the target population so as not to introduce bias into your results.
- Predictive Analysis: This analysis answers the “What is likely to happen in the future?” question. Predictive Analysis uses statistical techniques like regression models and machine learning algorithms to predict future events or outcomes based on past (historical) or current patterns and trends in the analyzed dataset. This allows organizations to plan ahead and make informed decisions based on their forecasts; for example, if sales are predicted to go down during summer months due to seasonality factors, they may choose to launch promotional campaigns or adjust spending accordingly. It can also help identify potential risks associated with certain decisions or actions an organization takes before they happen so that appropriate measures can be taken proactively rather than reactively after something has already gone wrong.
- Prescriptive Analysis: This analysis answers the “What is the best course of action?” question. The prescriptive analysis takes the predictive analysis one step further by recommending how best to act upon those predictions. It looks at what has happened, why, and what might happen to determine what should be done next. By combining insights gained through the other kinds of analyses (listed above) with advanced modeling methods such as artificial intelligence (AI) and optimization algorithms, prescriptive analysis helps organizations make better-informed decisions about their operations while minimizing risk exposure.
The different types of Data Analytics will be extensively detailed in the second part of this blog (Analytics 101).
Once curated data passes through these analyses, the outcomes (insights) can be shared with stakeholders or other interested parties. This could be done through reports, presentations, or dashboards, depending on what kind of information needs to be shared and with whom it’s being shared. Curated data and/or insights can also be shared “as-is” for further purposes, such as feature stores for machine learning algorithms, data monetization, API, etc.
Business analytics typically involves three major areas: dashboards, reports, and ad hoc analysis. Business analysts may focus on one or all of these areas, and data engineers need to understand the differences and related tools. In addition, by understanding analysts activities, data engineers can better serve data to meet their needs.

Dashboards provide a concise overview of an organization’s performance against key metrics, such as sales and customer retention. These metrics are presented in visualizations, summary statistics, or a single number. Think of a dashboard like the one you can find in a car that gives drivers a quick, easy-to-read display of critical information while driving. Similarly, analytics dashboards provide business executives an overview of the current shape of their organizations, allowing them to make the right decisions in an informed way.
2 - Operational Analytics
Operational analytics differs from business analytics mainly in terms of time. Business analytics takes a longer-term view of the issue being analyzed. While up-to-the-second updates may be helpful, they are not critical to the overall quality or outcome of the analysis. Conversely, operational analytics relies heavily on real-time updates, as they can be pivotal in promptly addressing issues as they arise. An example of operational analytics is real-time fraud detection. Many financial organizations want to know how their security systems are performing; if fraudulent activities occur, they want to be notified immediately.

However, the distinction between business and operational analytics has become increasingly blurred as streaming data and low-latency technologies become more ubiquitous. As a result, applying operational methodologies to business analytics challenges is becoming more common. For example, an online retailer can use real-time analytics to monitor website performance on Black Friday while tracking sales, revenue, and the effectiveness of advertising campaigns. This approach enables businesses to respond rapidly to changes in consumer behavior and market conditions, leading to more agile decision-making and improved outcomes.
In the mid-term, real-time will likely be the norm. Data products over the next decade will likely be streaming-first, able to seamlessly blend historical data.
3 - Embedded Analytics
In contrast to business and operational analytics that primarily target internal usage, there is a growing trend of external-facing or embedded analytics. Companies are leveraging the abundance of data available to offer end-users data applications that embed analytics within the application interface. These data applications are becoming increasingly popular among users who expect companies to utilize data to provide valuable insights. For example, smart home applications (domotics) that show temperature, luminosity, air quality, and energy consumption in real-time allow users to adapt and customize their living environment.

The use of embedded analytics is rapidly expanding, and I can expect; thanks to IoT; that these data applications will become even more widespread in the coming years. As a data engineer, your role may not involve developing the front end of these embedded analytics, as that is typically handled by application developers. However, since you are responsible for the data that support the embedded analytics, it’s essential to thoroughly understand the velocity and latency1 requirements specific to these applications.
Machine Learning
The second significant area of data serving is machine learning (ML). As ML becomes increasingly prevalent, I assume you are at least familiar with the concept. With the emergence of ML engineering as a parallel field to data engineering, you may wonder where data engineers fit into the picture. Although a data engineer doesn’t need to have a comprehensive understanding of machine learning (ML), having a basic understanding of how classical ML works and the fundamentals of deep learning can be tremendously helpful: The difference between supervised, unsupervised, and semi-supervised learning, the difference between classification and regression techniques, the various techniques for handling time-series data (time-series analysis and forecasting), How to encode categorical data and the embeddings for various types of data, the difference between batch (offline) and online (real-time) learning…
The boundaries between machine learning, data science, and data engineering vary widely between organizations. For example, in some organizations, ML engineers take over data processing for ML applications right after data collection or may even form a separate data journey parallel to the one that handles analytics.
But to be aligned with the current state of the art, the main role of data engineers here is to provide data scientists and ML engineers with the data they need to do their job. Some common ways to serve this data are:
1. File exchange is quite a common way to serve data. Curated data is processed and generated as files to consume directly by the final users. For example, a business unit might receive invoice data from a partner company as a collection of CSVs (structured data). A data scientist might load a text file (unstructured data) of customer messages to analyze the sentiments of customer complaints. 2. Databases are a critical component in serving data for analytics and ML. This discussion will implicitly focus on serving data from OLAP databases (e.g., data warehouses and data marts). The main advantage of serving data through a database is that a database imposes order and structure on the data via schemas. So a data contract can be established between the data engineers and data scientists on pre-defined requirements (form and content) of the served data.
Multiple databases can play the role of feature stores. A feature store is a centralized repository specifically designed for managing, storing, and sharing the features used in machine learning models. In machine learning, features are the input variables or predictors used to train models to make predictions or classifications. The feature store enables data scientists and engineers to store, discover, share, and reuse features across different models and applications, improving collaboration and productivity. In addition, it aims to reduce the operational burden for ML engineers by maintaining feature history and versions, supporting feature sharing among teams, and providing basic operational and orchestration capabilities, such as backfilling.
Another way to serve data for machine learning is through vector databases. A vector database is a type of feature store that holds data in the form of vectors or mathematical representations of data points. Machine Learning algorithms enable this transformation of unstructured data into numeric representations (vectors) that capture meaning and context, benefiting from advances in natural language processing and computer vision.

Vector Similarity Search (VSS) is a key feature of a vector database. It is the process of finding data points similar to a given query vector in a vector database. Popular VSS usages include recommendation systems, image and video search, explicit content detection in both images and videos, anomaly detection, and most recently, natural language processing (like ChatGPT). For example, if you build a recommendation system, you can use VSS to find (and suggest) products similar to a product in which a user previously showed interest.
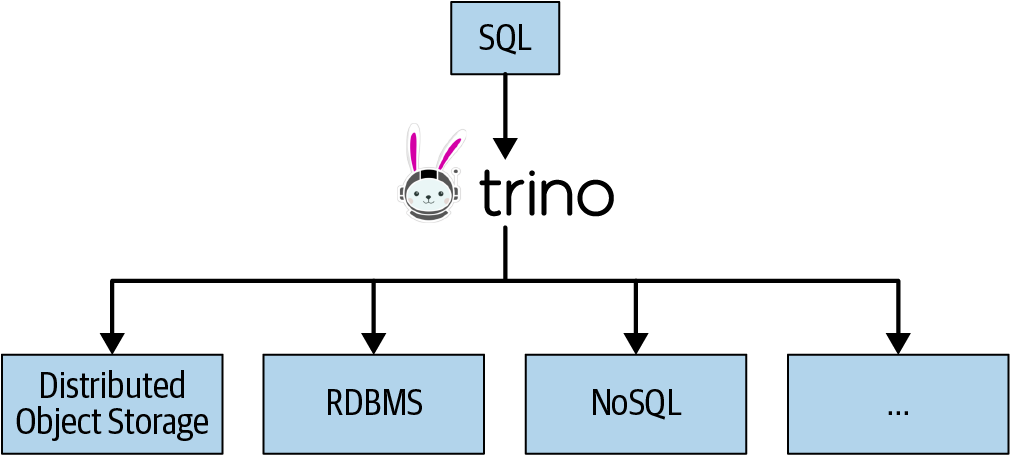
3. Data virtualization engines: Any query/processing engine that supports external tables can serve as a data virtualization engine. Data virtualization is closely related to federated queries, in which data is pulled from multiple sources, such as data lakes, RDBMSs, and data warehouses, without being stored internally. Federation is becoming more popular as distributed query virtualization engines gain recognition as ways to serve queries without going through the trouble of centralizing data in an OLAP system. Instead, you can perform queries on practically anything. The main advantage of federated queries is read-only access to source systems, which is perfect when you don’t want to serve files, database access, or data dumps. The end-user reads only the version of the data they’re supposed to access and nothing more.
4. Semantic Layer is an abstraction layer that sits between the end-users and the underlying data sources. It provides a simplified and business-oriented view of the data, shielding the users from the complexity of the underlying data structures and technologies.
The semantic layer acts as a bridge between the data sources and the end-users, allowing them to interact with the data using a common business vocabulary rather than having to understand the technical details of the data. Furthermore, it translates business concepts and terminology into queries that can be executed against the data sources, providing a consistent and intuitive user experience.
The semantic layer typically includes data models, business rules, calculations, and metadata that describe the data and its relationships. It may also include security and access controls, which allow administrators to manage user permissions and data access. The most common form of semantic layers is data marts, but you can also use materialized views and federated queries as a semantic layer.
Reverse ETL
Nowadays, Reverse ETL is a popular term that refers to the process of loading data from an OLAP database back into a source system. However, experienced data engineers may have already performed similar tasks in the past. As a result, reverse ETL gained traction in the late 2010s and early 2020s and is now considered a formal data engineering responsibility.
For example, a data engineer may extract customer and order data from a CRM and store it in a data warehouse to use it for training a lead scoring model. The model’s results are then stored back in the data warehouse. The company’s sales team intends to use these scored leads to boost sales and hence requires access to them. Using reverse ETL and loading the scored leads back into the CRM is the easiest approach for this data product. Reverse ETL takes processed data from the output side of the data journey and feeds it back into source systems.

Data Serving Underlying Activities
In a data journey, the underlying activities come to an end with data serving. Data serving is your final chance to make your data in great shape before it gets into the hands of end-users. Therefore, data engineers should tackle the following activities carefully:
- Security: The security principles remain unchanged whether one is sharing data with individuals or systems. It is common to observe indiscriminate data sharing with no consideration given to access controls or the intended use of the data. Such actions can lead to disastrous consequences, including data breaches, resulting in hefty fines, negative publicity, and job losses. It is crucial to take security measures seriously, particularly during this lifecycle stage, as serving presents the most significant security surface among all stages. In most cases, serving data is restricted to read-only access, except when individuals or processes need to modify information in the queried system. To ensure proper data management, it is advisable to provide read-only access to specific databases and datasets unless a user’s role necessitates advanced privileges such as write or update access. This can be achieved by grouping users with particular IAM roles, such as analysts or data scientists, or by creating custom IAM roles as necessary. Service accounts and roles should be set up similarly for systems. Additionally, it is important to limit access to a dataset’s fields, rows, columns, and cells, where appropriate, for both users and systems. Access controls should be as precise as possible, and access should be revoked once it is no longer necessary. Make sure users can access only their data and nothing more.
- Data Management: At the serving stage, you’re mainly concerned with ensuring that people can access high-quality and trustworthy data. It is advisable to include both semantic and metrics2 layers in your serving layer and employ rigorous data modeling that accurately conveys business logic and definitions. Doing so will establish a single source of truth for all serving purposes, including analytics, machine learning, reverse ETL, and others. This approach will enhance the consistency, accuracy, and reliability of your data, thereby improving your overall data management and decision-making capabilities.
- DataOps involves monitoring the various steps involved in data management, including data quality, governance, and security. It operationalizes data management to ensure optimal data performance and reliability. Some of the crucial aspects to monitor in DataOps include data health and downtime, as well as the latency of systems serving data, such as dashboards and databases. Additionally, monitoring data quality, system security and access, and the versions of data and models being served is essential. It is also necessary to track uptime to achieve the desired service level objective (SLO) for your data management system. By closely monitoring these factors, you can ensure the optimal performance and reliability of your data management system.
- Orchestration: Data serving is the final stage in the data journey, and it is a highly complex area due to its downstream position in the lifecycle. It involves the coordination of data flows across multiple teams, and therefore, orchestration plays a crucial role in automating and organizing complex work. However, orchestration is not only a way of organizing complex tasks but also a means of ensuring the smooth and timely delivery of data to consumers. To achieve this, it is necessary to coordinate the various stages of the data engineering lifecycle to ensure that data is available to consumers at the promised time. By doing so, you can ensure that your data management system operates efficiently and effectively and meets your organization’s needs.
Summary
The serving stage is about data in action. But what is a productive use of data? To answer this question, you need to consider two things: what’s the use case, and who’s the user?
The use case for data goes well beyond viewing reports and dashboards. High-quality, high-impact data will inherently attract many interesting use cases. But in seeking use cases, always ask, “What action will this data trigger, and who will be performing this action?” with the appropriate follow-up question, “Can this action be automated?” Whenever possible, prioritize use cases with the highest possible ROI. Data engineers love to obsess over the technical implementation details of the systems they build while ignoring the basic question of purpose. Engineers want to do what they do best: engineer things. When engineers recognize the need to focus on value and use cases, they become much more valuable and effective in their roles.
The data journey concludes logically at the serving stage, and like all lifecycles, there is a feedback loop that occurs. Therefore, it is essential to view the serving stage as an opportunity to learn what is working well and what can be improved. Stakeholder feedback is critical, and it is important not to take offense when issues are raised, as they inevitably will be. Instead, use this feedback constructively to identify areas for improvement in what you have built. By doing so, you can continually enhance the quality and effectiveness of your data platforms and products.
Now that we’ve taken a journey through the data journey, you know how to design, architect, build, maintain, and improve your data products. In the next series of this blog, I’ll turn your attention to a few well-known data platforms, where we’ll make some hands-on exercises to ingest, store, process, and serve data.
References
- Reis, J. and Housley, M. Fundamentals of data engineering: Plan and build robust data systems. O’Reilly Media (2022).
- Dehghani, Z. Data Mesh: Delivering Data-Driven Value at Scale. O’Reilly Media (2022).
1. Latency becomes the new outage.
2. a metrics layer is a tool for maintaining and computing business logic. (conceptually, this concept is extremely similar to the semantic layer). This layer can live in a BI tool or software that builds transformation queries. A concrete example is Data Build Tool (dbt).